Profitability discussions often become disconnected: finance focuses on cost and margin, while operations focuses on manpower, hours and production targets. In this project, I built a common analytical bridge between the two teams. The dashboard compares two operating scenarios using the same 1,200-workstation capacity and 10-hour working day, then converts changes in efficiency, leave and calendar availability into production, turnover, factory cost and profit before tax.
1. The business question
The central question was not simply, “How many workers do we have?” It was:
How effectively are paid workforce hours converted into saleable standard hours, and what is the financial effect of improving or losing that conversion?
This required finance, production, industrial engineering, HR and factory management to use one driver tree rather than separate departmental reports.
2. The productivity-to-profit model
The model connected four levels of performance:
This sequence made the discussion understandable to non-finance managers: every paid hour either becomes value-adding standard time or is lost through waiting, breakdown, changeover, imbalance, rework, absence or other off-standard activity.
3. Excel dashboard view
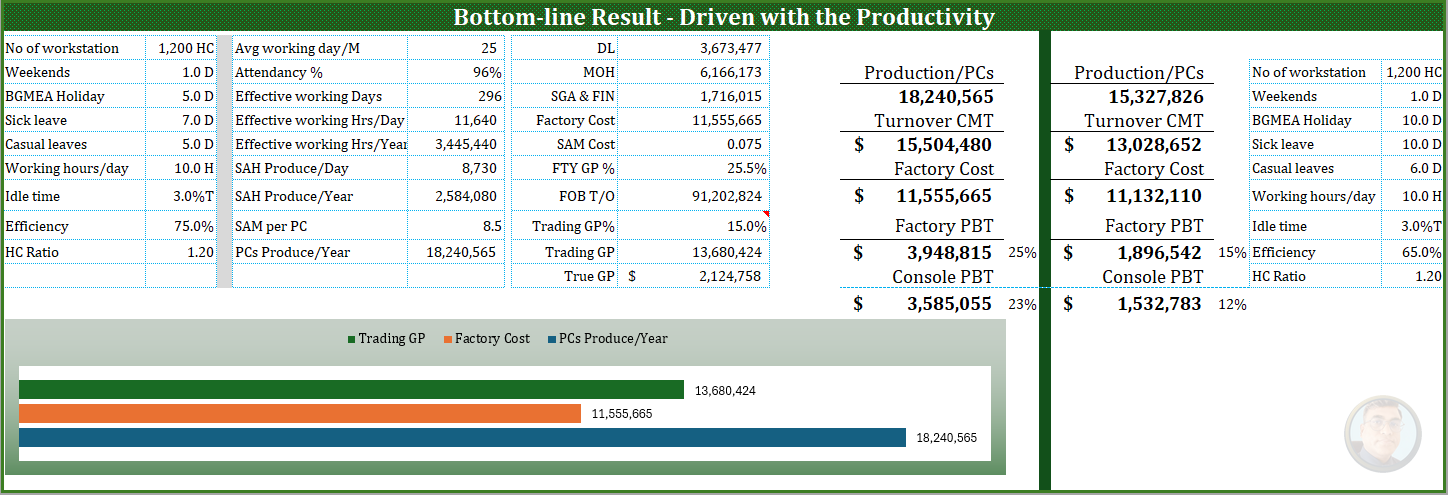
The dashboard below shows the exact operating assumptions and modeled outcomes used in the case study. The left side represents the improved-productivity scenario; the right side shows the 65% efficiency comparison case.
4. Dashboard scenario assumptions
The dashboard compares a 65% efficiency case with a 75% efficiency scenario. Workstation capacity, daily hours, idle time and headcount ratio remain unchanged, so the output and profit movement can be traced primarily to productivity and workforce-availability assumptions.
| Operational driver | 65% efficiency case | 75% efficiency scenario | Interpretation |
|---|---|---|---|
| Workstations / core capacity | 1,200 | 1,200 | No permanent capacity increase |
| Working hours per day | 10.0 | 10.0 | Same paid-hour envelope |
| Idle / off-standard proxy | 3.0% | 3.0% | Held constant in the displayed comparison |
| Headcount ratio | 1.20 | 1.20 | Same staffing structure |
| Efficiency | 65.0% | 75.0% | 10 percentage-point productivity improvement |
| Planned holiday days | 10 | 5 | More effective production-calendar availability, subject to legal and employee-entitlement requirements |
| Sick leave assumption | 10 days | 7 days | Modeled benefit from health, safety and continuity support |
| Casual leave assumption | 6 days | 5 days | Modeled benefit from engagement and predictable leave planning |
The comparison is important because it demonstrates operating leverage: the model does not depend on more workstations or a longer day. It depends on converting a larger share of existing paid capacity into earned standard time and saleable output.
5. Main productivity elements
| Element | Operational mechanism | Financial linkage | Management focus |
|---|---|---|---|
| Workforce capacity and skill mix | Correct staffing and cross-skilling remove bottlenecks and balance operations. | More output per employee and lower support cost per unit. | Skill matrix, line balance, span of control and headcount ratio. |
| Working days and paid hours | Define the maximum available capacity. | Increase potential output but also expose labor and overhead cost. | Match production calendars to confirmed demand. |
| Efficiency | Converts attended minutes into earned standard minutes. | Lowers labor cost per standard minute and raises contribution. | Method improvement, training, balancing and hourly target control. |
| On-standard time | Measures time spent producing against approved standards. | Improves output without increasing payroll. | Material, machine, method and operator readiness. |
| Off-standard time | Includes waiting, breakdown, changeover, imbalance, meetings and rework. | Creates hidden labor and overhead cost and increases overtime pressure. | Reason codes, Pareto analysis and daily root-cause closure. |
| Overtime | Adds temporary capacity after regular hours. | Creates value only when marginal contribution exceeds premium, fatigue and quality loss. | Demand-backed approval and post-OT productivity review. |
| Sick leave and health support | Health, ergonomics and preventive support improve workforce continuity. | Protect production days and reduce replacement and emergency OT cost. | Occupational health, clinic response, ergonomics and preventive programs. |
| Casual leave and engagement | Engagement and predictable leave planning reduce unplanned absence and turnover. | Protect team stability and reduce learning-curve disruption. | Supervisor contact, recognition, grievance closure and fair leave planning. |
| Quality and rework | First-pass quality determines whether produced hours become saleable output. | Prevents material, labor, delivery and margin leakage. | Quality at source; classify rework as off-standard time. |
6. Quantified productivity-to-profit result
The following figures are taken from the two scenarios displayed in the dashboard. Changes are calculated from the 65% efficiency case to the 75% efficiency scenario.
| Result | 65% efficiency case | 75% efficiency scenario | Change |
|---|---|---|---|
| Annual production | 15,327,826 pcs | 18,240,565 pcs | +2,912,739 / +19.0% |
| CMT turnover | 13,028,652 | 15,504,480 | +2,475,828 / +19.0% |
| Factory cost | 11,132,110 | 11,555,665 | +423,555 / +3.8% |
| Factory PBT | 1,896,542 | 3,948,815 | +2,052,273 / +108.2% |
| Factory PBT margin | 15% | 25% | +10 percentage points |
| Consolidated PBT | 1,532,783 | 3,585,055 | +2,052,272 / +133.9% |
| Consolidated PBT margin | 12% | 23% | +11 percentage points |
This is the core finance message for non-finance managers: productivity is not only an output KPI. When demand exists and quality is protected, a higher conversion of paid hours into standard output improves overhead absorption and creates a much larger percentage movement in PBT than in revenue.
7. How I made the model useful to finance and non-finance teams
- Started with operational language: workers, days, hours, standard minutes and output.
- Converted each operational driver into money: unit cost, overhead absorption, turnover, contribution and PBT.
- Separated structural improvement from capacity expansion: efficiency and loss elimination came before additional workers or overtime.
- Used scenario analysis: management could see the effect of a one-point efficiency change, one-point idle-time reduction or one-day absence reduction.
- Defined ownership: finance governed the economics; operations owned efficiency and losses; HR owned attendance, health and engagement; quality owned rework and saleability.
8. Key management insights
Efficiency should be improved before capacity is added
The dashboard shows the same 1,200-workstation capacity producing 2.91 million additional pieces when efficiency rises from 65% to 75%. This is why balancing, methods, skills and loss-time control should be addressed before permanent capacity is added.
Attendance is necessary, but on-standard time creates value
A worker can be present without producing standard output. The central KPI is the conversion of attended minutes into on-standard, first-quality production.
Health support is a productivity investment
The improved scenario models sick leave at 7 days instead of 10. Preventive health, ergonomics, timely medical support and safer work design can protect continuity and reduce replacement pressure, but the objective is healthier attendance—not restricting legitimate sick leave.
Engagement should reduce unplanned absence, not restrict leave rights
The scenario models casual leave at 5 days instead of 6. Better supervisor relationships, recognition, grievance resolution and predictable leave planning can reduce avoidable disruption while preserving fair employee entitlements.
Production-calendar planning affects available capacity
The dashboard comparison reduces planned holiday days from 10 to 5. Any calendar optimization must comply with applicable law, industry requirements and employee entitlements; the management principle is to plan production and leave earlier so available days are used predictably.
Quality must be included in productivity
Output that requires rework or cannot be sold does not create the expected contribution. Rework minutes should therefore be measured as off-standard loss.
9. Recommended improvement sequence
- Confirm demand and saleable-output requirements.
- Protect attendance through health, safety and engagement support.
- Record on-standard and off-standard minutes by reason code.
- Eliminate waiting, breakdown, imbalance, changeover and rework losses.
- Improve methods, skills, line balance and first-pass quality.
- Optimize direct and indirect headcount ratios.
- Use overtime only for profitable, approved and demand-backed capacity.
- Review actual financial benefits against the model every month.
Conclusion
The project demonstrated that profitability improves when the same paid capacity generates more saleable standard hours. In the dashboard comparison, output increased 19.0% while factory cost increased only 3.8%, lifting factory PBT from 1.90 million to 3.95 million model units.
By translating efficiency, attendance, leave planning and time utilization into production, turnover and PBT, the model gave finance and non-finance managers one fact base for prioritizing operational improvement. The consolidated PBT result increased from 1.53 million to 3.59 million model units, with margin improving from 12% to 23%.
Confidentiality note: Company identity and currency have not been disclosed. Figures reproduce the anonymized scenario values visible in the project dashboard and are presented as decision-support outputs, not audited realized savings. Results should be validated against actual demand, price, cost, quality, legal requirements and workforce conditions before implementation.

Written by Liakat Hossain
Finance and accounts professional with experience in FP&A, SAP FICO, Power BI, internal control, reporting, audit, tax, VAT and export-oriented business operations.
This article is original educational content based on professional finance practice. Real-project examples are anonymized, and scenario figures are identified as model outputs rather than guaranteed results.